IELTS Speaking Part 1 – Happy Things. 1. Is there anything that has made you feel happylately? 2. What made you happy when you were little?

IELTS Rapid Course Overview: This course is tailored for students preparing for the IELTS exam [...]
Master IELTS Vocabulary List: A Comprehensive Resource for English Language Learners Introduction: The Master IELTS [...]
IELTS Speaking Part 1 - Happy Things 1. Is there anything that has made you [...]
IELTS Speaking Part 1 - Happy Things 1. Is there anything that has made you [...]
IELTS Speaking Part 1 – Happy Things. 1. Is there anything that has made you feel happylately? 2. What made you happy when you were little?

IELTS Speaking Part 2 & 3 – People – Describe a place you have been to where there were lots of people You should say: Where it is

IELTS Speaking Part 2 and 3 : Complaint – Describe a complaint that you made and you were satisfied with the result You should say:

IELTS Speaking Part 2 and 3 – Game – Describe the game you enjoyed playing when you were younger. You should say:
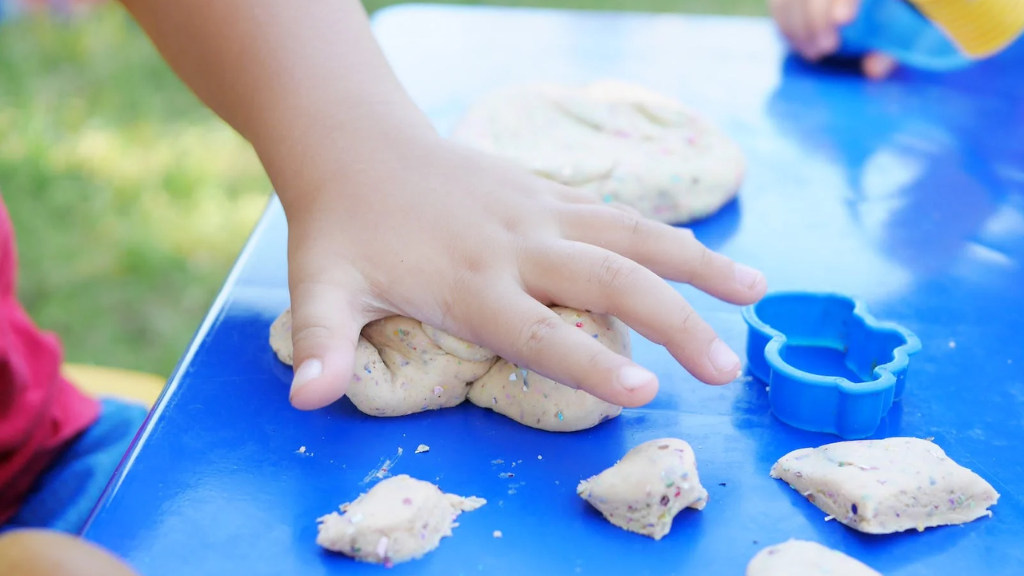
IELTS Speaking Part 2 & 3 -Activity – Describe an activity you enjoyed in your free time when you were young. You should say: What it was?
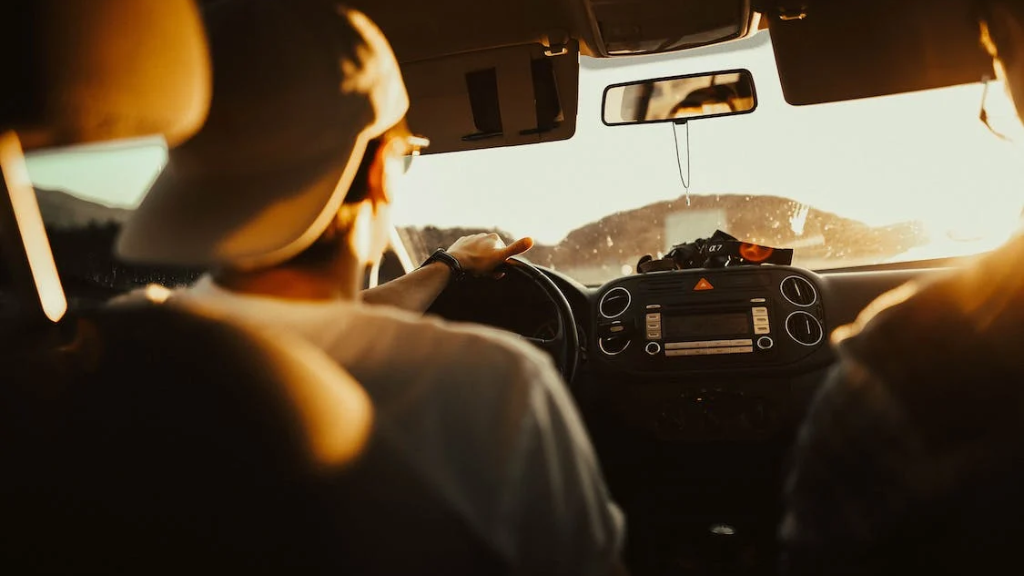
IELTS Speaking Part 2 and 3 : Car Journey Describe a car journey that you remember well You should say: Where you went What you did

IELTS Speaking Part 2 and 3 – Moved – Describe someone you know who has recently moved to a new place you should say: Who he/she is

IELTS Speaking Part 1 – Chocolate – Do you like eating chocolate? Why or why not? How often do you eat chocolate?

IELTS Speaking Part 1 – Rain- 1. Do you like rainy days? Why?2. Does it rain much in your city?3. Would you like to live in

IELTS Speaking Part 2 and 3 – Book – Describe a book that you have read many times. You should say: What the book is? What is in this book?
IELTS Speaking Part 2 & 3 – ActorDescribe a film character played by an actor or actress whom you admire You should say:•
IELTS Speaking Part 1 – Art Do you like art? Do you like visiting art galleries? Do you want to be an artist? Do you like modern

IELTS Speaking Part 1 – Jewelry1. Do you often wear jewelry? 2. What type of jewelry do you like? 3. Do you usually buy jewelry?
IELTS Speaking Part 1 – Ice Cream 1. Do you like ice cream? 2. Do you eat ice cream a lot? 3. Did you eat ice cream as a child? …

IELTS Speaking Part 1 – T-Shirt: Do you like wearing T-shirts? How often do you wear T-shirts? Do you like T-shirts with pictures or prints?

IELTS Speaking Part 1 – Friends: How important are friends to you? Do you often go out with your friends? Where do you often meet each other?

IELTS Speaking Part 1 – Day Off When was the last time you had a few days off? What do you usually do when you have days off?

IELTS Speaking Bag – 1. Do you usually carry a bag? 2. Do you change your bags often? 3. What kind of bags would you use when travelling?

IELTS Speaking Part 2 and 3: Actors and Actresses Describe a film character played by an actor or actress whom you admire. Read More.

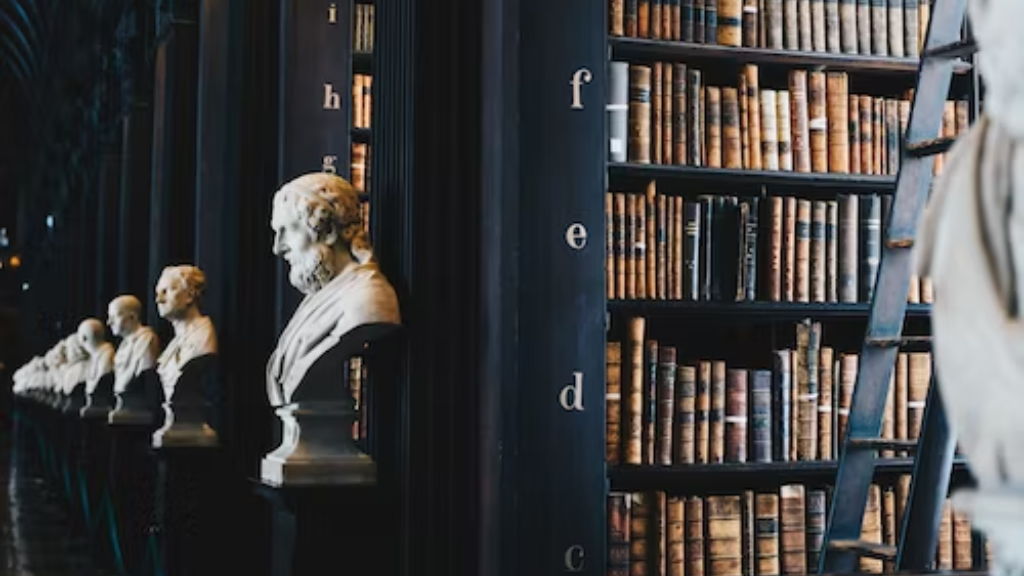
IELTS Speaking Part 1 – Library Do you often go to the library? What do you usually do in the library? Did you go to the library…

IELTS Speaking Part 1 – Music: What music do you like? What music do you dislike? Do you often listen to one type of music?

IELTS Speaking Part 1 – Health: How do you keep healthy? What are your favorite sports? Are there health classes in your school?

IELTS Speaking Part 1 – Friends: How important are friends to you? Do you often go out with your friends? Where do you often meet each other?

Daily English: Meeting People (A1) Topic is about Meeting People Level is For A1 Student. Read to learn more.
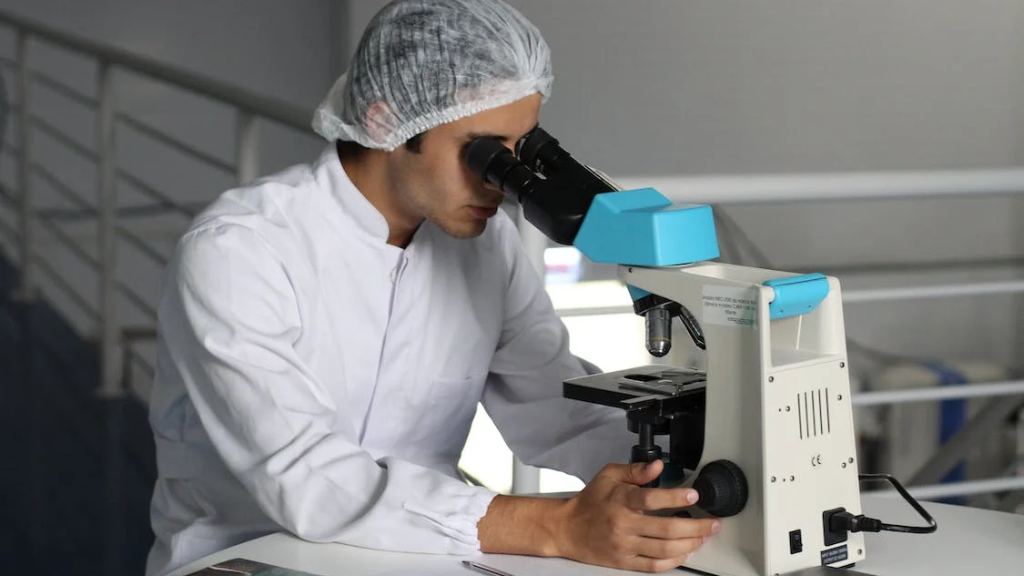
IELTS Speaking Part 1 – Science Did you like studying science when you were at school? [Why/Why not?] What do you remember about …

IELTS Speaking Part 1 – Science: Did you like studying science when you were at school? [Why/Why not?] What do you remember about …
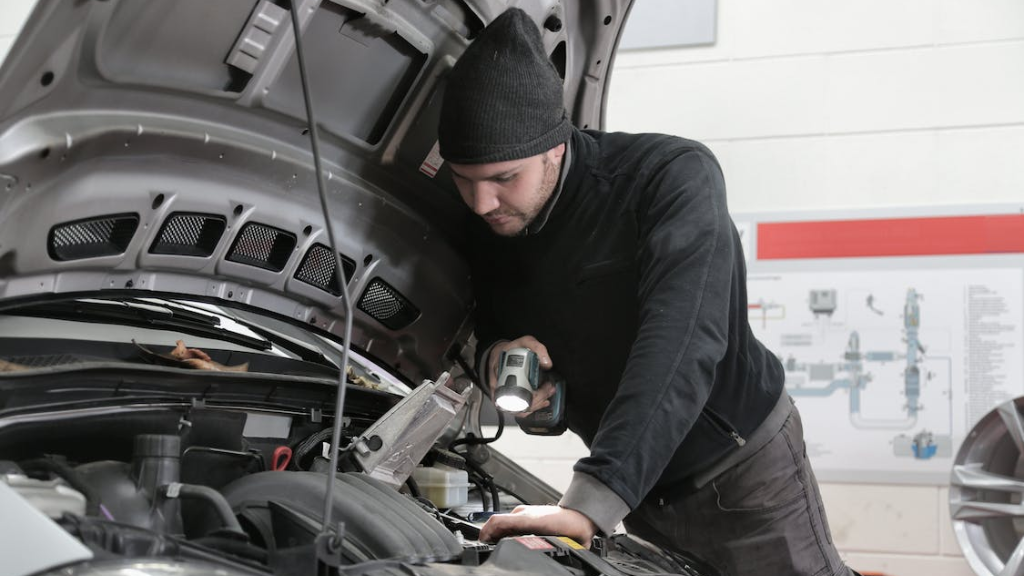
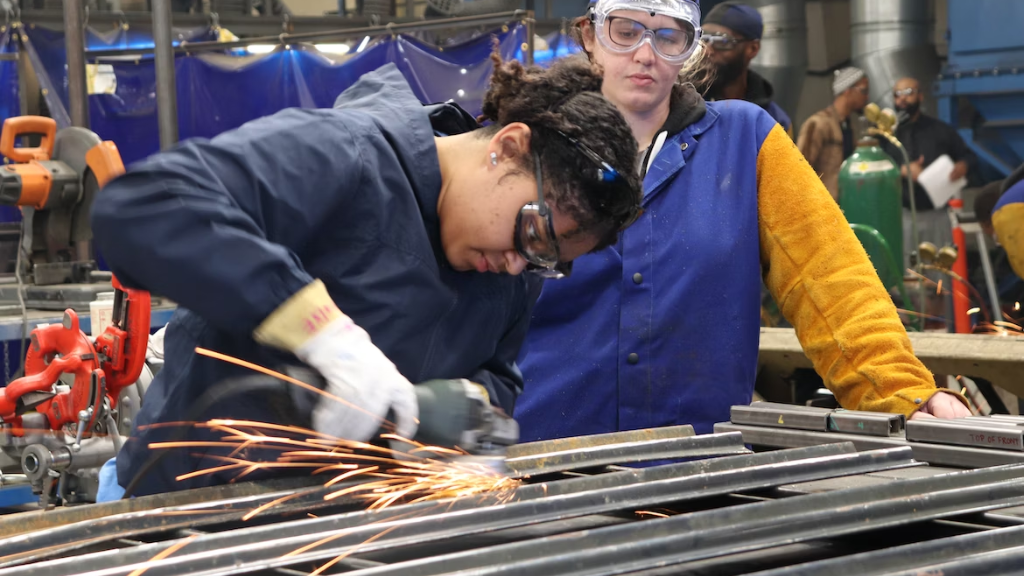
IELTS Speaking Part 1 – Fixing Things Can you fix things? Did anybody teach you to fix things when you were a child? Do you think …
IELTS Writing Living in Cities: The graph below gives information about the percentage of the population in four Asian … Read More.

IELTS Speaking Part 1 – Dream and Ambition What was your childhood dream? Are you the kind of person who sticks to dreams?

IELTS Speaking Part 1 – Days Off When was the last time you had a few days off? What do you usually do when you have days off?
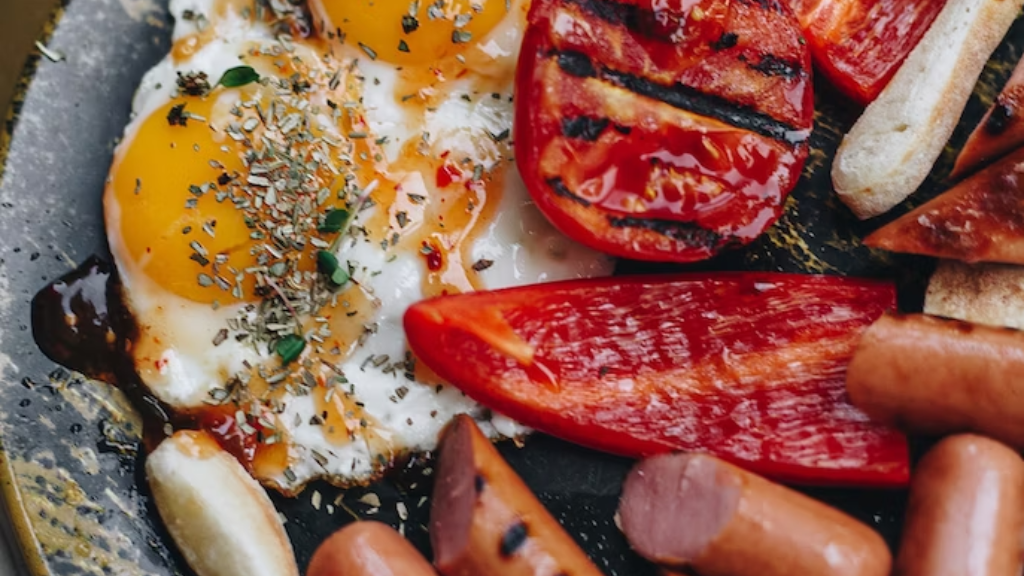
IELTS Speaking Part 2-3 – Food and Drink. To replicate decent fish and chips, I needed to find the perfect fish. Unfortunately,.. Read More
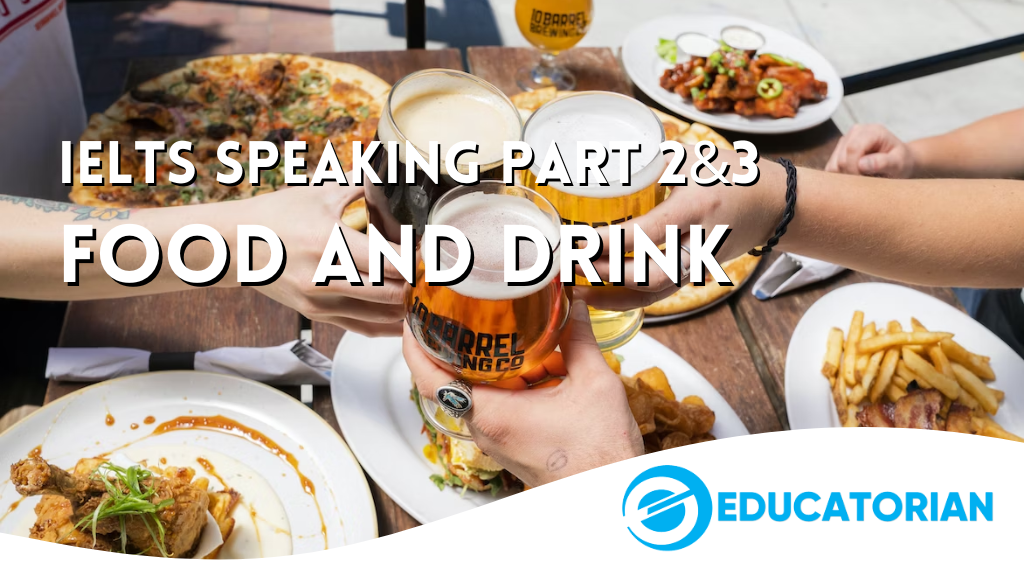
IELTS Speaking Part 2 and 3 – Food and Drink – I developed a strong liking for pasta, but most of the pasta dishes in my country… Read More

IELTS Speaking Part 2 – Food and Drink – Describe some food or drink that you learned to prepare. You should say: Read to learn more.

IELTS Speaking Part 1 – Paying Bills: Yes, I have forgotten to pay bills a couple of times in the past, especially when I was younger.

IELTS Speaking Part 1 – Fixing Things – Part 1. Can you fix things?2. Did anybody teach you to fix things when you were a child? Read More

IELTS Speaking Part 1 – Paying Bills: Paying bills. What kinds of bills do you have to pay? How do you usually pay your bills — in cash …

IELTS Speaking Part 1 – Concentration: 1. Did you stay focused in class when you were a child? Read to learn more.

IELTS Writing Task 2 – 科技 Record Things: Some people believe that using modern technology (digital photographs, blogs) is the best way to …
IELTS Speaking Part 2 and 3 : Jobs – Describe an interesting job that you want to have in the future You should say: What it is… Learn More

IELTS Writing Task 2 – 媒体 Internet News: More and more people no longer read the newspaper or watch TV programs to get news.
IELTS Writing Task 2 – 文化 Museums and Galleries: Nowadays some people claim that public museums and art galleries … Read More

IELTS Writing Task 2 – Technology and Relationships: Nowadays the way many people interact with each other has changed because of technology.
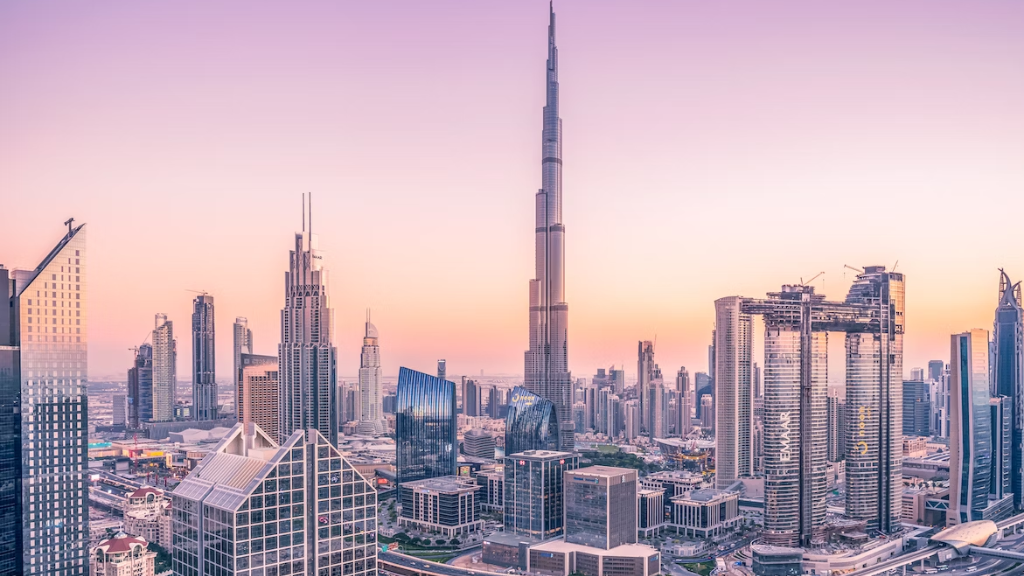
IELTS Writing Task 2 – 社会 Living in Cities : The best way to deal with the rising problem of traffic and transportation is by … Read More
IELTS Writing Task 2 – IELTS Writing Task 2 – 教育 History In School. Read to learn more. Discuss both views and give your opinion.(教育)
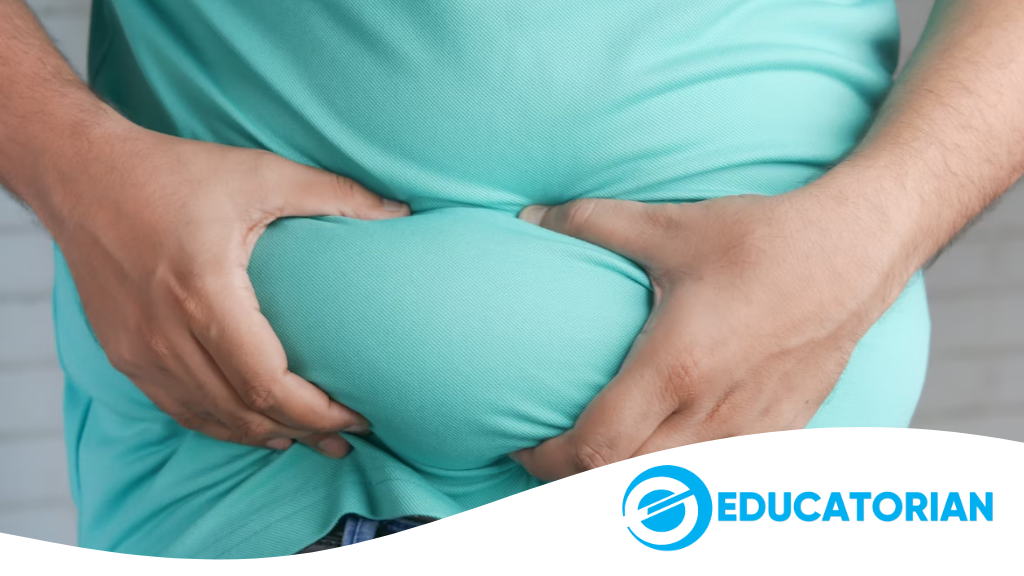
IELTS Writing Task 2 – Weight of People: In some countries the average weight of people is increasing and their levels of health and …
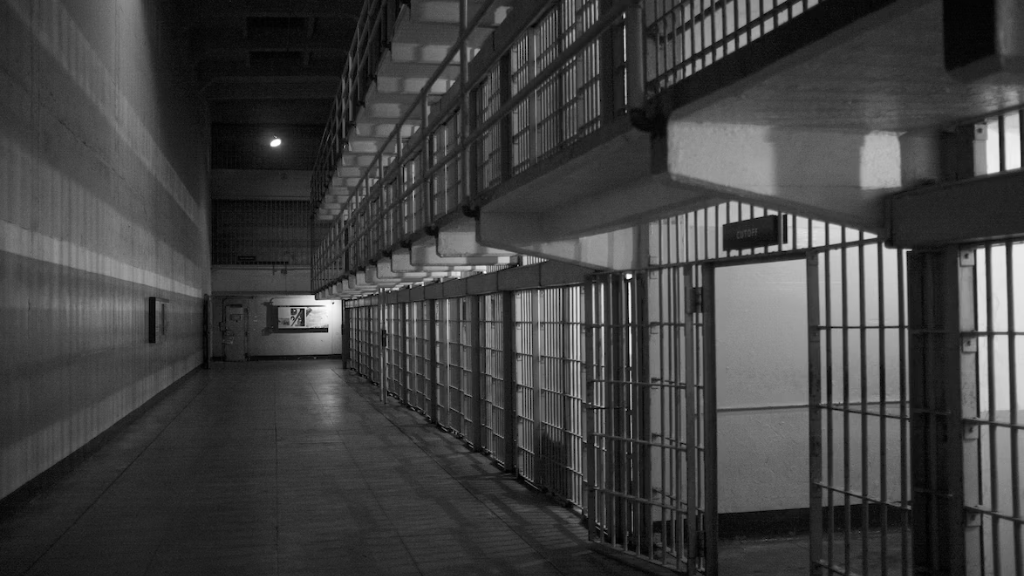
IELTS Writing Task 2 – 犯罪 Educating Criminals – Study shows that many criminals have low levels of education. For this reason, some people …

IELTS Speaking Part 1 – Ice Cream. 1. Do you like ice cream? 2. Do you eat ice cream a lot? 3. Did you eat ice cream as a child? Read More.
IELTS Writing Task 2 – Many museums and historical sites are mainly visited by tourists but not local people. (旅游) Read More
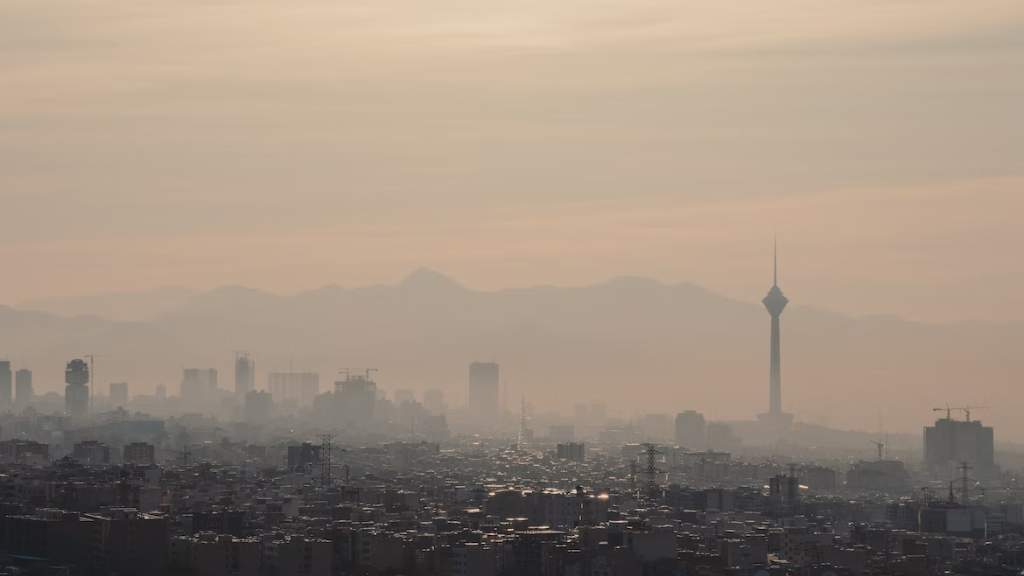
IELTS Speaking 2 and 3 – Air Polluted Place: Describe a place you visited where the air was polluted You should say: Where the place is

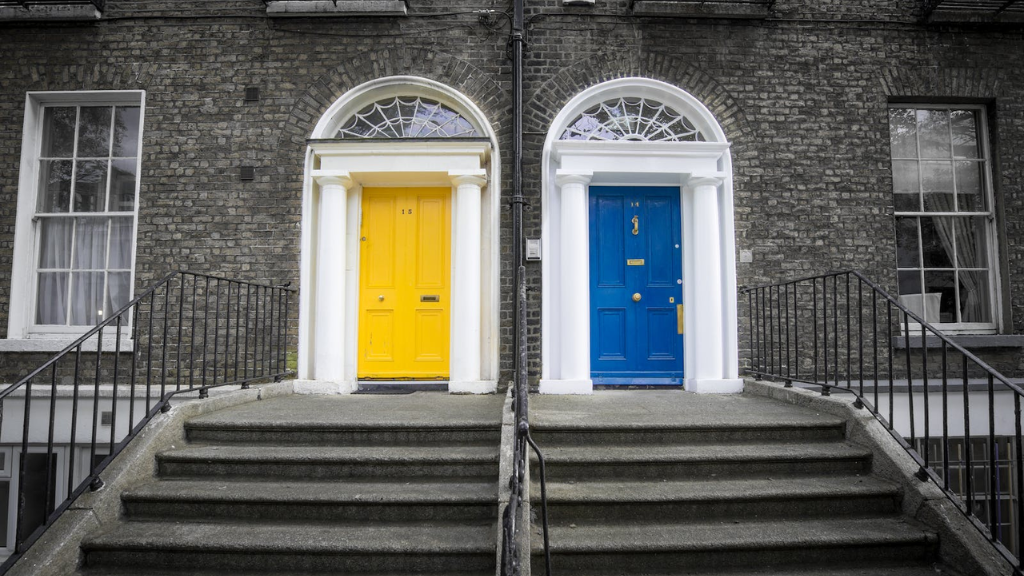
IELTS Speaking Part 1 – Part 1 What kind of house or flat do you want to live in in the future? 2. Are the transport … Read More
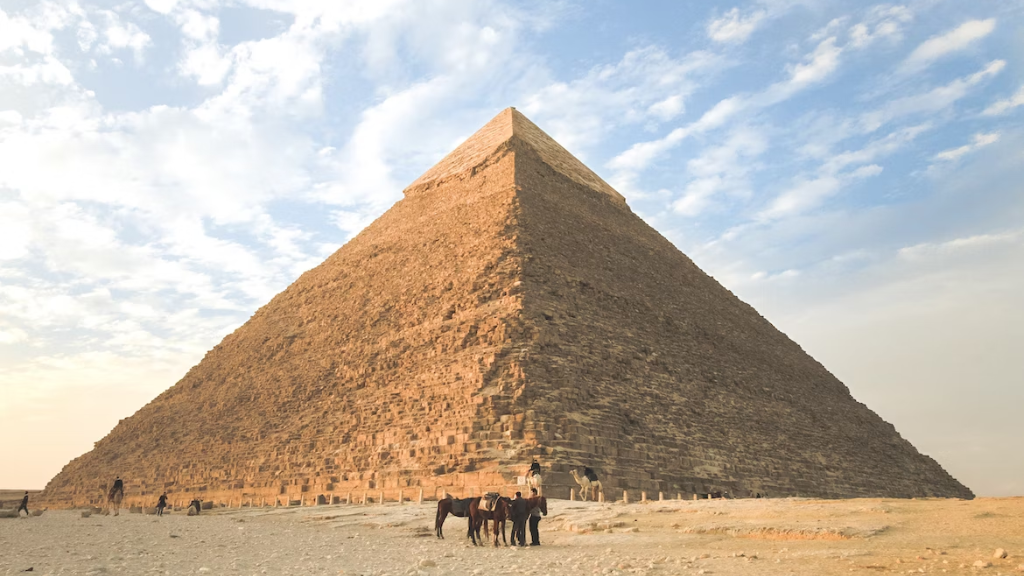
IELTS Speaking Part 2 and 3 – Adventure Describe an exciting adventure you would like to take in the future. You should say: Read More.
IELTS Speaking Part 1 – Fixing Things – Part 1. Can you fix things?2. Did anybody teach you to fix things when you were a child? Read More

IELTS Speaking Part 2 and 3: Describe a famous person you are interested in. Who he/she is ? Read to learn more.

IELTS Speaking Part 1 – Health – How do you keep healthy? What are your favorite sports?Are there health classes in your school? Read More.
IELTS Speaking Part 1 – Dream and Ambition – What was your childhood dream? Are you the kind of person who sticks to dreams? Learn More

IELTS Speaking Part 1 – Doing Sports – What sports do you like? Where did you learn how to do it?, Read to Learn more

Today, we shall delve into the fundamental aspects of IELTS writing that often elude many candidates. Read this article to learn more.
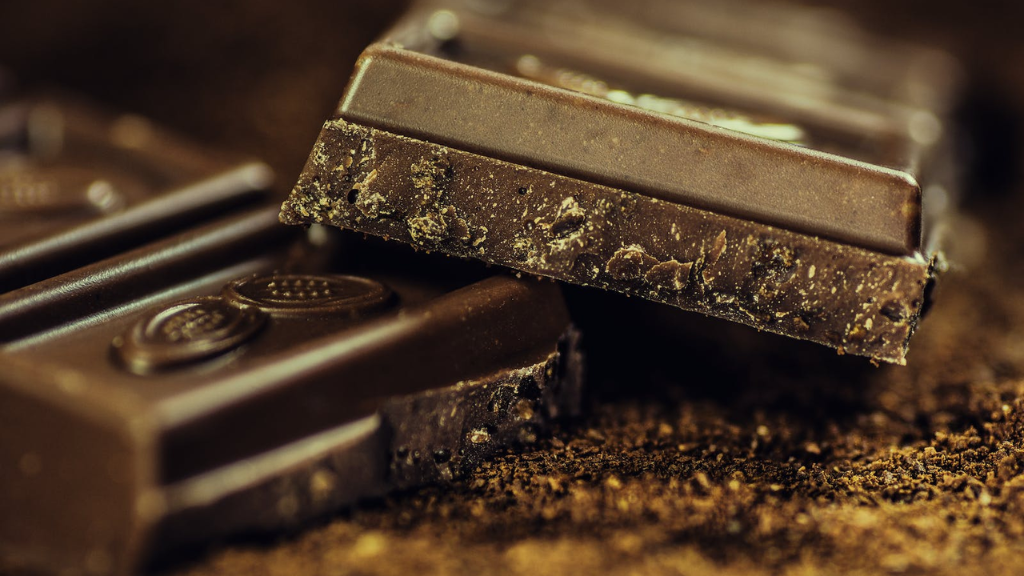
IELTS Speaking Part 1 – Chocolate – Do you like eating chocolate? Why or why not? How often do you eat chocolate? Read More.
IELTS Speaking Part 1 – Day off – When was the last time you had a few days off? What do you usually do when you have days off?. Read More

IELTS Speaking Part 2 and 3 : Adventure and Travel : Describe an exciting adventure you would like to take in the future… Read More.
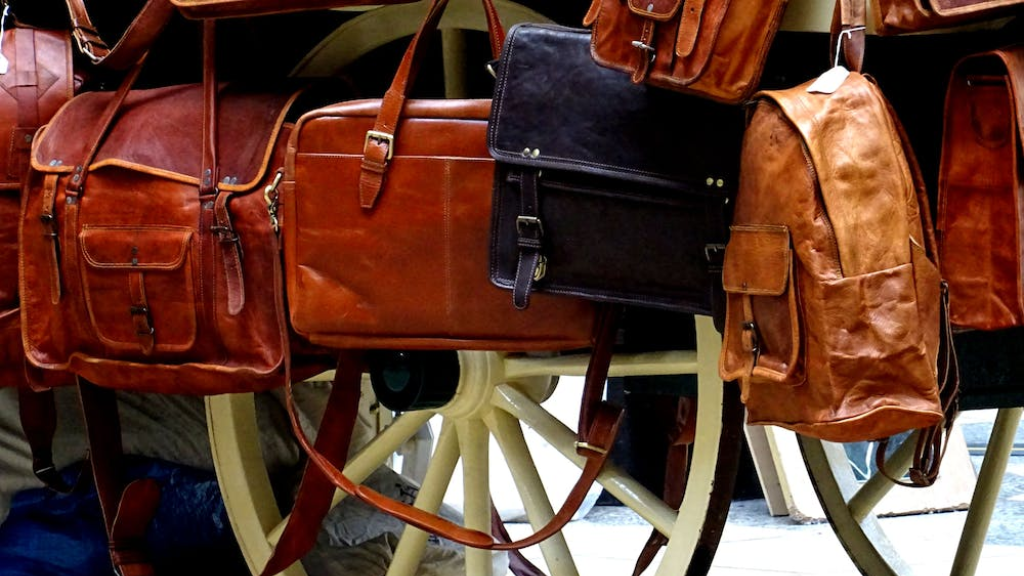
IELTS Speaking Part 1 – Bags – Do you usually carry a bag? Do you change your bags often? What kind of bags would you use… Read More
IELTS Speaking Part 1 – Concentration Did you stay focused in class when you were a child? Are you a focused person? Read More
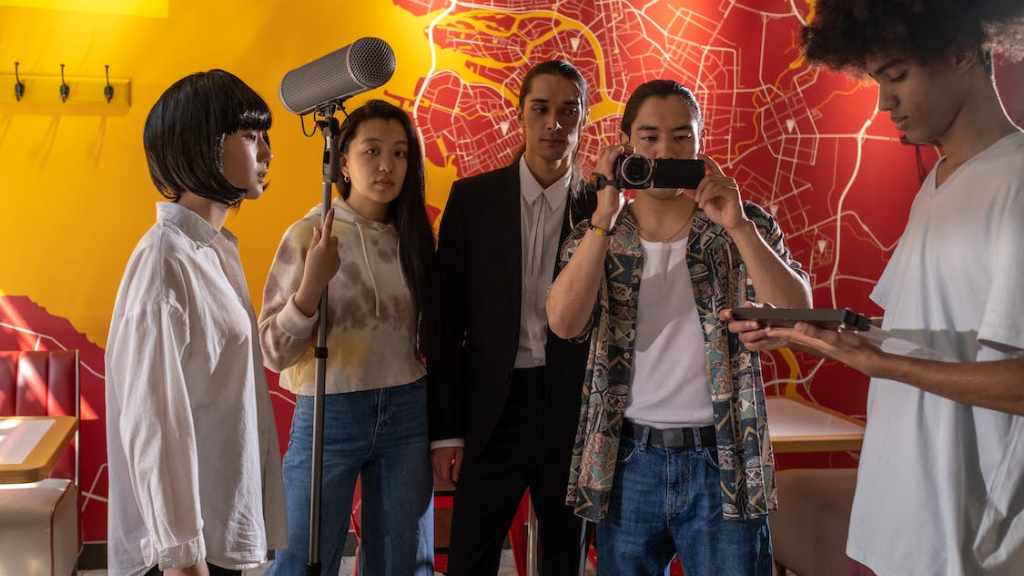
Describe something that you did with someone/a group of people You should say: What it was Who you did it with How long it took you…
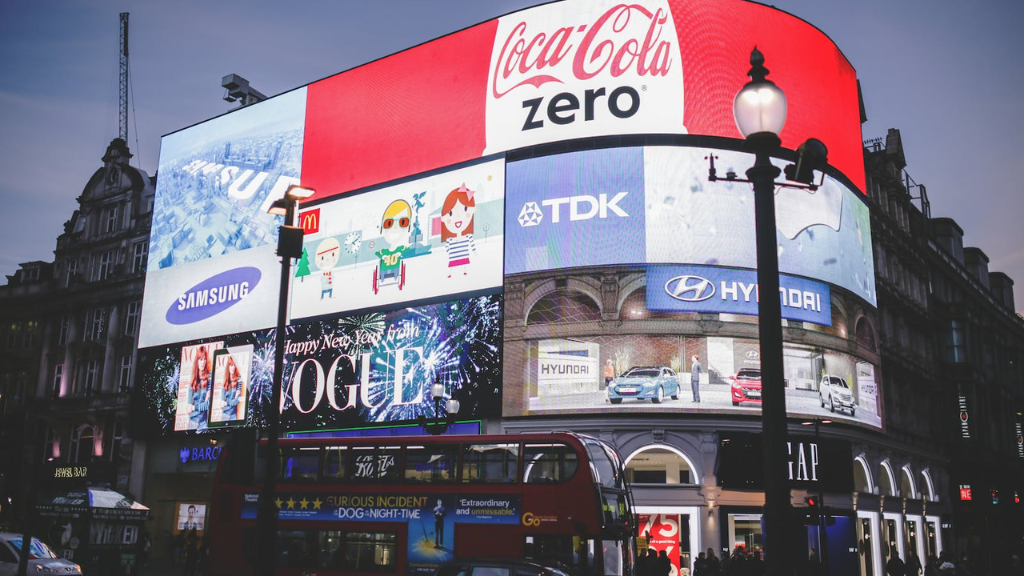
Describe an advertisement you have seen but you did not like You should say: Where and when you saw it What the advertisement … Read More.
Describe a film character played by an actor or actress whom you admire You should say: Who this actor/actress is When you saw … Read More

IELTS Speaking Part 1 – Art: Do you like art? Do you like visiting art galleries?, Do you want to be an artist?. Read More.
IELTS Writing Task 1: The pie chart represents the leading movie genres in 2022, while the accompanying table displays the respective …

To effectively prepare for the IELTS Speaking Test, Topic: Arts and Artists. Check this post to learn more about how to “Rizz” the test.
IELTS Speaking Part 1 – Bags – Do you usually carry a bag? Do you change your bags often? What kind of bags would you use when travelling?
IELTS Task 2 -Some people think learning history in school is important. Others think learning subjects more relevant to life is important.
IELTS Writing Task 2 – Increasing the price of petrol is the best way to solve growing traffic and pollution problems. To what extent do you
IELTS Task 2 – Academic: Some people think environmental problems are too big for individuals to solve. Others, however, think that those problems cannot be solved unless individuals take some action. Discuss both views and give your opinion.
IELTS Writing Task 1 AC: Sugar Production – The diagram below shows the manufacturing process for making sugar from sugar cane. Summarise …
IELTS Writing Task 1 AC: Adult Education – The charts below show the results of a survey of adult education. The first chart shows the ….
IELTS Speaking Part 3 – Photos – Why do some people like to record important things with photos? What can people learn from historical…
IELTS Speaking Part 3 – Beautiful Things – Do you believe there are more beautiful things today than in the past? Why? What are some of …
IELTS Speaking Part 3 – All About Sharing. Do you think kids like to share? Why? How can parents teach their children to share? Read more…
IELTS Speaking Part 3 – All About Friendships. Do you still keep in touch with your friends from childhood? Why or why not? 2. How Impor…
IELTS Writing Task 1 AC: British Students – The charts below show the proportions of British students at one university in England …
Doing Sports- What sports do you like? • Where did you learn how to do it?• Did you do some sports when you were young?

IELTS Speaking Part 2: Describe a film character played by an actor or actress whom you admire. Read to learn more.
IELTS Speaking Part 1 – Happy Things – Is there anything that has made you feel happy lately? What made you happy when you were little?
Doing Sports- What sports do you like? • Where did you learn how to do it?• Did you do some sports when you were young?
IELTS Writing Task 1 AC: Cement Production – The diagrams below show the stages and equipment used in the cement-making process, and ….
IELTS Speaking Part 1 – Library – • Do you often go to the library? • What do you usually do in the library? •Did you go to the library …

IELTS Speaking Part 1 – Technology – • What technology do you often use, computers or cellphones? • What electronic devices have you…
IELTS Speaking Part 1 – Morning Time – • Do you like getting up early in the morning?• What do you usually do in the morning?
IELTS Speaking Part 1 – Keys – Do you always bring a lot of keys with you?• Have you ever lost your keys? •Do you often forget the keys …
IELTS Speaking Part 1 – Jewelry – • Do you often wear jewelry? – • What type of jewelry do you like? • Do you usually buy jewelry?
IELTS Speaking Part 1 – Chocolate – • Do you like eating chocolate? Why or why not? • How often do you eat chocolate?• Did you often eat chocolate when you were a kid?
IELTS Speaking Part 1 – Arts • Do you like art?•Do you like visiting art galleries?•Do you want to be an artist? •
The graph below shows the quantities of goods transported in the UK between 1974 and 2002 by four different modes of transport. Read to learn
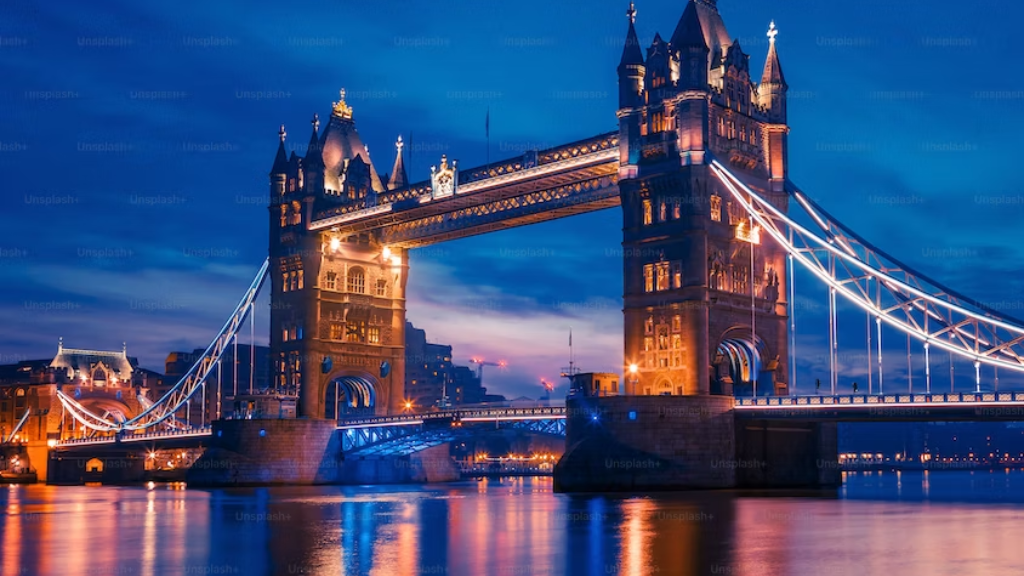
IELTS Speaking Part 1 – Hometown – • Where is your hometown? • Is that a big city or a small place? Check the post to read more.

IELTS Speaking Part 1 – home-and-accommodation • Do you live in a house or a flat? Check the post to read more.
IELTS Speaking Part 1 – All about Geography. Do you like geography? Have you ever studied geography at school? Check the post to read more.
Here are the questions that might appear for the Official IELTS Speaking exam in China for January to April 2023. Check and learn more
How to make an introduction for the IELTS writing test for Task 2 Writing. What are the requirements? Check this page to learn more.
IELTS Speaking Part 1 – All about Birthday. What do you usually do on your birthday? Check the post to read more.
The three pie charts below show the changes in annual spending by a particular UK sch001in 1981, 1991 and 2001. Check to learn more.

The charts below show changes in the cost of visiting a national park in the country from2011 to 2018. Check to learn more.