IELTS Writing Task 1 – Academic – Population in Urban Areas
IELTS Writing Task 1 – Academic – Population in Urban Areas
Check Cambridge Trainer Test 1
You should spend about 20 minutes on this task.
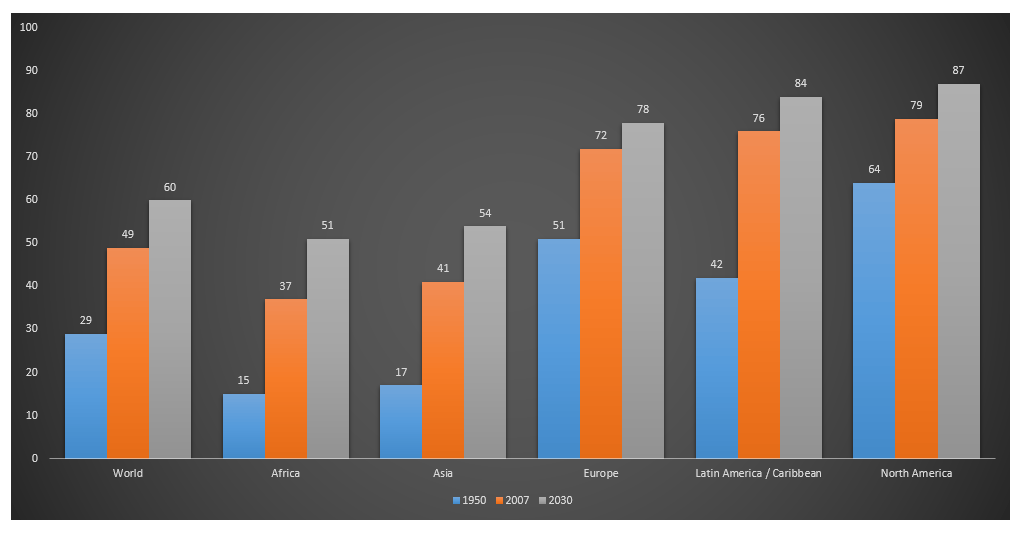
The bar chart below gives information about the percentage of the population living in urban areas in the whole world and different parts of the world. Summarise the information by selecting and reporting the main features, and make comparisons where relevant. Write at least 150 words.
Version 1
The bar graph compares the global percentage of the population residing in urban areas across five continents from 1950 to 2007, along with a forecast for 2030. Overall, there is an anticipated increase in the urban population worldwide, with North America projected to have the highest ratio among the five regions.
In 2007, nearly half (49%) of the world’s population lived in urban areas, marking a one-fifth increase compared to six decades prior. Approximately four in ten individuals in Africa and Asia resided in cities in 2007, reflecting a 20% difference compared to 1950. In contrast, Europe and North America had 72% and 79% of their populations in urban areas, respectively. Meanwhile, Latin America experienced the most significant growth in its urban population, soaring from 42% to 76% in just fifty-seven years.
In 2030, it is anticipated that six out of ten people worldwide will be residing in cities. Furthermore, over half of the populations in Africa and Asia are expected to be urban dwellers, with projected percentages of 51% and 54%. Europe foresees a 6% increase in urban population growth. In contrast, the majority of the Americas’ population, particularly North America, is expected to be living in cities, reaching 87%.
Version 2
The bar graph illustrates the shifts in urban population worldwide and across specific continents from 1950 to the projected figures for 2030. Overall, within seven decades, a significant migration to urban areas has occurred.
On a global scale, it is anticipated that 60% of the world’s population will reside in urban settings by 2030, marking a twofold increase compared to the data from 80 years ago. Notably, Africa and Asia are expected to experience substantial growth, with 51% and 54% of their populations living in urban areas, contrasting starkly with the 15% and 17% recorded in 1950, respectively.
In Europe, there was a remarkable surge in urban population, jumping nearly 20% in 2007 and reaching 72%. The projected increase over the next 23 years is a more modest 6%. In North America, six out of ten people lived in urban areas back in 1950, and this is expected to rise to 23% after 80 years. The most significant surge is expected in Latin America and the Caribbean, where the urban population is projected to double from 42% in 1950 to 84% in 2030.
Version 1:
1. Anticipated
2. Ratio
3. Urban population
4. Projected
5. Resided
6. Reflecting
7. Contrast
8. Meanwhile
9. Soaring
10. Foresees
Version 2:
1. Illustrates
2. Migration
3. Significant
4. Starkly
5. Remarkable
6. Surge
7. Modest
8. Projected
9. Deviation
10. Consistent
Notes:
This one is noticeably more challenging than the regular Cambridge IELTS series. That’s the intended difficulty level. There are various approaches to tackling this. However, I find the easiest way for me is to focus on the years 1950, 2007, and 2030. Specifically, I concentrate on 2007 and compare it to 1952. I aim for simplicity in structure. Limiting myself to three paragraphs: an introduction, an overview comparing 2007 to 1950, and a section on 2030. My objective is not to generate a multitude of sentences but to carefully select the most crucial points. Be concise rather than overly detailed, following the suggestion to prioritize a well-thought-out selection.
If you observe, in version 2, I didn’t emphasize 2007 as much. This is because, for me, it serves as a midpoint. Sometimes it’s not as crucial as understanding the trends in 1950 and anticipating 2030. If there’s a deviation or a significant change, that’s worth mentioning. However, if the trend is consistent growth, the focal points are the beginning and the end. That’s what holds more importance.
Please visit the website Educatorian to find suggested answers for IELTS speaking questions. Additionally, I recommend checking out Ian’s personal website for further information.
请访问Educatorian网站,找到雅思口语问题的建议答案。此外,我建议查看伊恩的个人网站以了解更多信息。

Ian Tanpiuco – Virtual Assistant, Educatorian, and IELTS Rizz Tutor. Ian’s goal is to enhance his students’ IELTS scores through a comprehensive curriculum that focuses on understanding rather than mere memorization.