IELTS Writing Task 1 – Academic – International Tourist Arrivals
Check Cambridge Trainer Test 3
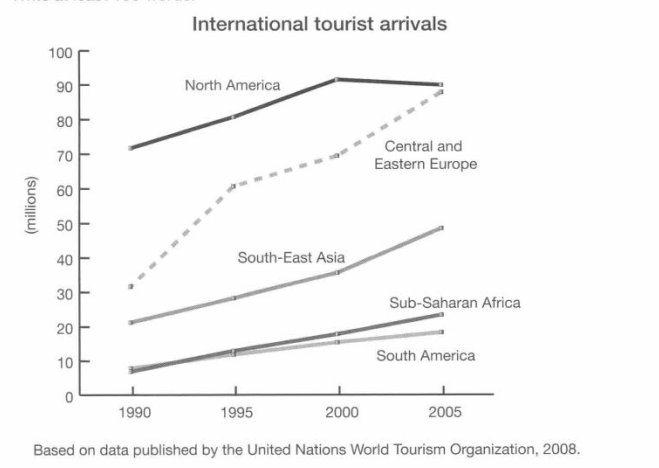
The graph below gives information about international tourist arrivals in different parts of the world.
Summarise the information by selecting and reporting the main features, and make comparisons where relevant. Write at least 150 words.
Version 1
The line graph compares international tourist arrivals in different parts of the world from 1990 to 2005. Overall, within fifteen years, there was a significant increase in tourist numbers, especially in Central and Eastern Europe.
Only around nine million visitors from South America and Sub-Saharan Africa were recorded in 1990. This trend continued to occur over the past five years, and by 2005, around 20 million tourists were coming from Sub-Saharan Africa, while only 17 million came from South America. In contrast, South East Asia accounted for 50 million tourists, making it the third-place region, a 30 million difference compared to 15 years ago.
North American tourists in 1990 were at 70 million, the highest among other nationalities, and a 40 million gap compared to Central and Eastern Europe. However, there was a sudden surge of European tourists, skyrocketing to 60 million in less than five years. By 2000, the gap between North American and European tourists came closer, at 90 million and 70 million, respectively. By 2005, both tourists from these regions reached around 85 million, with North America still leading despite a slight decrease.
Version 2
The line graph depicts the international tourist arrivals from various parts of the world between 1990 and 2005. In general, North America attracted the largest number of tourists, while the Southern counterpart had the lowest figures.
Tourist arrivals from Southeast Asia ranked third, totaling 20 million in 1990 and experiencing substantial growth to 50 million within 15 years. On the other hand, Sub-Saharan Africa and South America started at the same level with 5 million tourists in 1990. Over the subsequent years, they remained relatively stable, but by 2000, Sub-Saharan African tourist numbers began to rise, resulting in a notable difference by 2005, reaching 22 million.
Despite a significant initial gap of around 40 million tourists between Central and Eastern Europe compared to North America in 1990, there was a gradual narrowing. North America reached 70 million tourists in 1990, and by 1985, there was a sharp increase in tourist numbers from Central and Eastern Europe. This upward trend continued, and by 2005, both regions managed to attract around 85 million tourists, closing the initial disparity.
Notes:
Related IELTS Topics
- IELTS Academic Writing Task 1: Survey of Adult Education
- IELTS Cambridge 16: Writing Task 1 – Test 3 – Academic – Sugar Production
- IELTS Academic Writing Task 1: Line Graph National Park
- IELTS Academic Writing Task 1: Annual Spending

Ian Tanpiuco – Virtual Assistant, Educatorian, and IELTS Rizz Tutor. Ian’s goal is to enhance his students’ IELTS scores through a comprehensive curriculum that focuses on understanding rather than mere memorization.